ga-dashboard-graph-bars
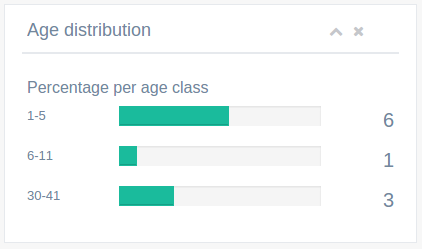
Render a bars graph in panel as in Gentelella index. The graph consists of ga-progress bars.
Binding reference
graph-title: The graph panel title (string)graph-sub-title: The subtitle presented next to title in smaller font size (string)graph-heading: The heading in the content (string)graph-data: The main graph data (array)
The graph data should follow the format:
[{lower: 1, upper: 5, percentage: 15, count: 6}, ...]
Transclude
The component allows the transclude of further content below.
Code sample
<ga-dashboard-graph-bars graph-title="Age distribution"
                         graph-heading="Percentage per age class"
                         graph-data="$ctrl.dashboard.ages"></ga-dashboard-graph-bars>