ga-dashboard-graph-chart
Render a chart.js graph in panel as in Gentelella index.
Binding reference
graph-title: The graph panel title (string)graph-sub-title: The subtitle presented next to title in smaller font size (string)graph-heading: The heading or name of the series (string)graph-id: A unique HTML id for jquery reference, defaultmain-graph(string)graph-type: The Chart.js type: line, bar, radar, pie, doughnut, bubble (string)graph-max-values: If the values provided are more than this number, the remaining will be added to the last. For example, if the chart shows top 5 cities, and 6 are provided, the 6th value will be added to the 5th. Default 5 (integer)graph-max-ellipsis: If the above parameter is used, the text to replace the last label with. Default ‘All others’ (string)graph-colours: An array of strings with colours for the series, defaults to gentelella colours (array)graph-data: The main graph data (array)
The graph data should follow the format:
[{label: '', value: 0}, ...]
Transclude
The component allows the transclude of further content below.
Controller
The controller:
- Groups the data to the specified maximum (if any).
- Transforms the data from the above more common JSON format to Chart.js format.
- Initializes the Chart.js graph appropriately.
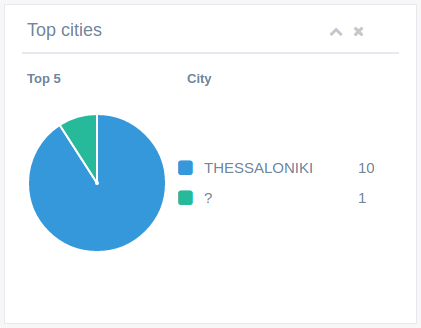
Code sample
<ga-dashboard-graph-chart graph-title="Top cities"
                          graph-heading="City"
                          graph-id="canvas2"
                          graph-type="pie"
                          graph-data="$ctrl.dashboard.cities"></ga-dashboard-graph-chart>